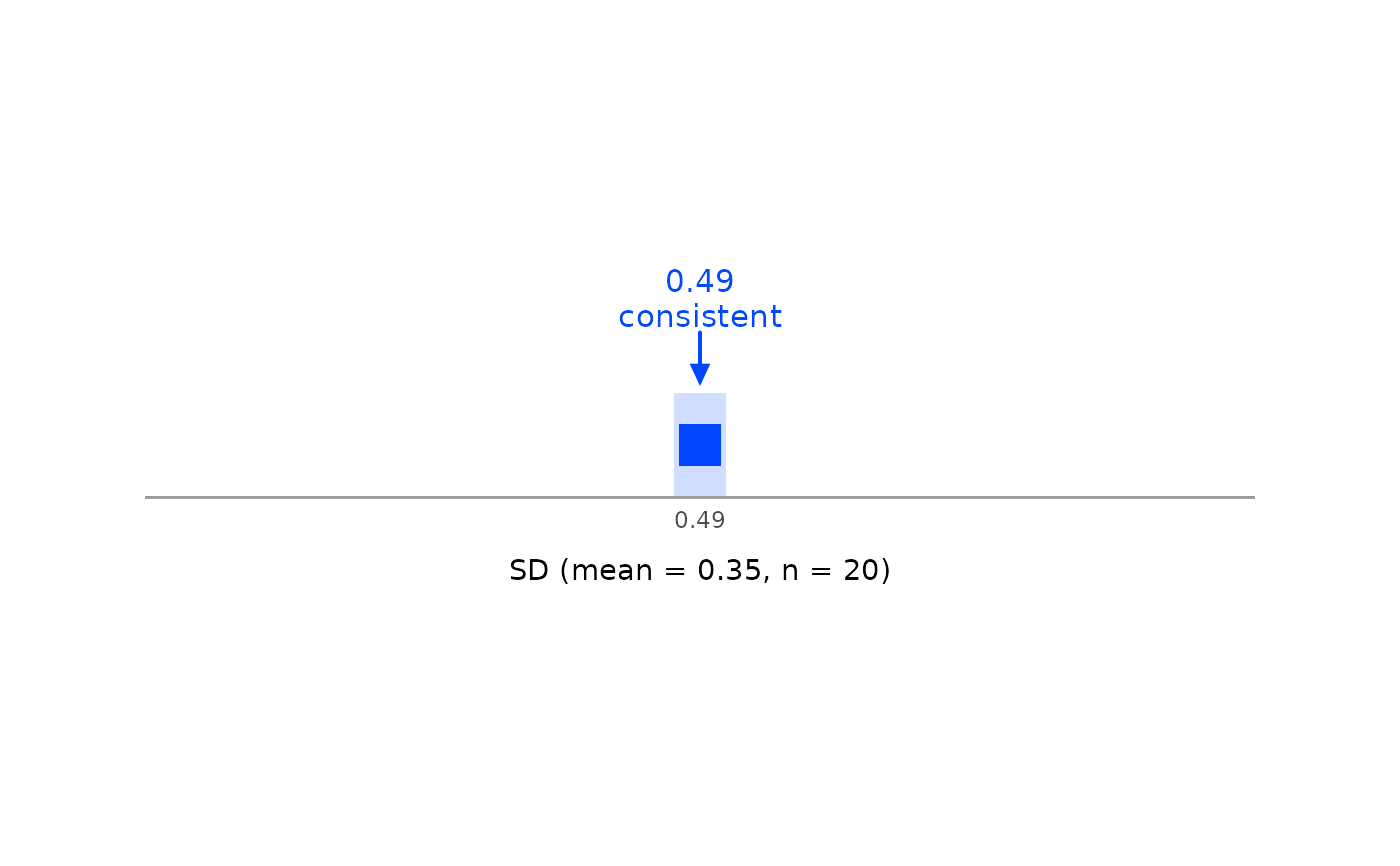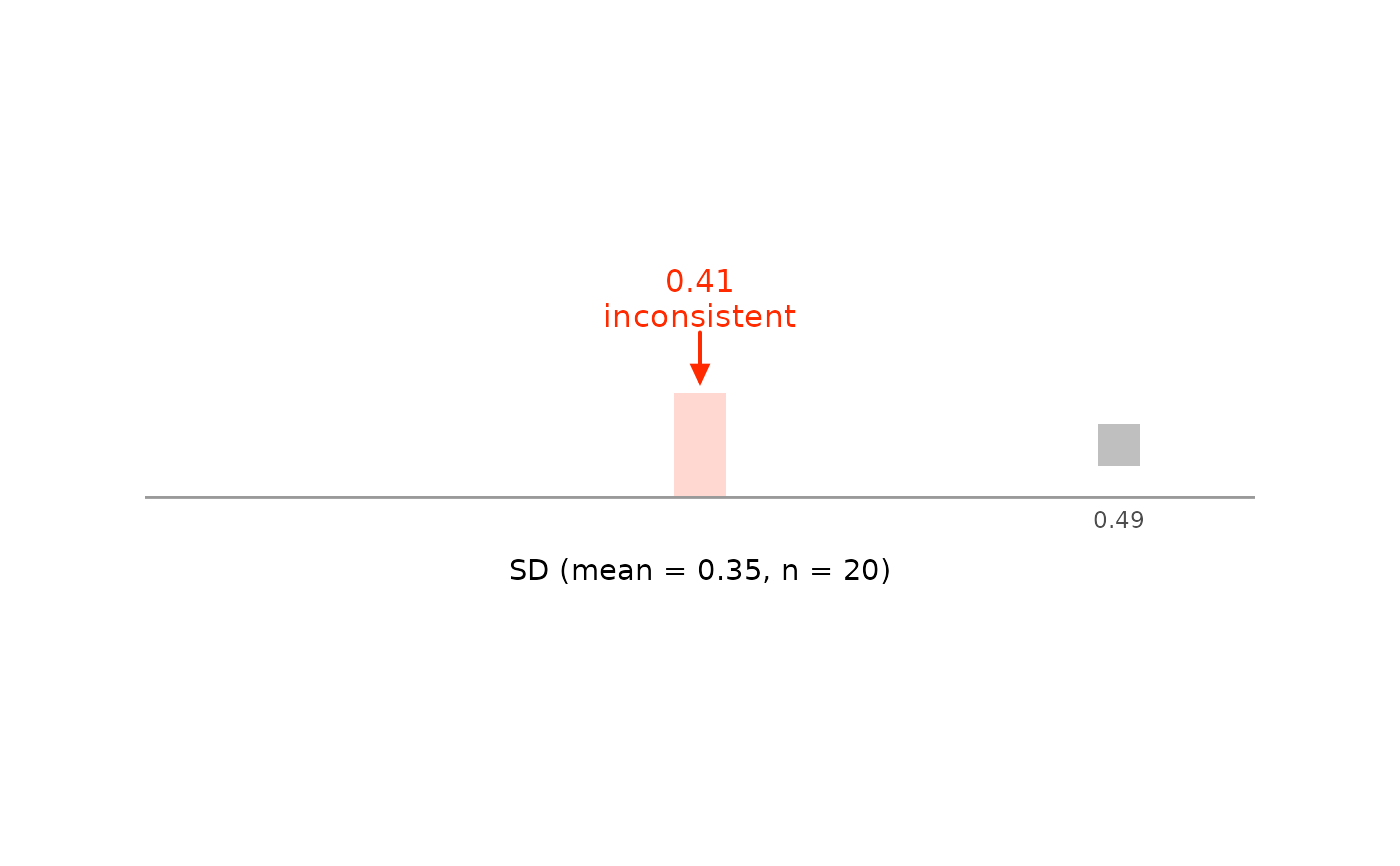

debit_plot_line() draws the DEBIT test for a single value set, as
grimmer_plot_line() does for GRIMMER. Of all SDs that could have been
reported with digits_sd decimal places, each square is one that n
binary values with mean x could have; the others are left out. The
reported SD is marked above the row and labeled as consistent or
inconsistent.
For many value sets, debit_plot() shows the results of
debit_map(). debit_values() lists the unrounded means and SDs
behind a reported pair.
Usage
debit_plot_line(
  x,
  sd,
  n,
  digits_x,
  digits_sd,
  data_type,
  sd_meaning = c("sd_sample", "sd_pop", "sd_sample_or_pop", "se"),
  formula = c("exact", "mean_n"),
  rounding = "up_or_down",
  threshold = 5,
  symmetric = FALSE,
  zoom = c("close", "medium", "wide"),
  color_con = "#0047ff",
  color_incon = "#ff2a00",
  color_attainable = "grey75"
)
Arguments
- x, sd, n, digits_x, digits_sd, sd_meaning, formula, rounding, threshold, symmetric
The same as in
debit(), butx,sd,n,digits_x, anddigits_sdmust have length 1.- data_type
String.
"integer"if the values are 0 and 1, as indebit(). There is no default, so that every call states this assumption."continuous"andNAare errors: if the data may be continuous, there are no values to draw.- zoom
String. How much of the row to show:
"close"(the default),"medium", or"wide"; see Details.- color_con, color_incon
Strings. Color of the marker, the strip behind the squares, and the square at the reported value if it is consistent.
color_conapplies if the value is consistent,color_inconif not. Defaults are"#0047ff"and"#ff2a00".- color_attainable
String. Color of the squares for attainable values that were not reported, like the consistent cells of
grim_plot_grid()'s raster. Default is"grey75".
Details
zoom works as in grim_plot_line(), but with
zoom = "wide", the row runs from 0 to 1, the range of debit()'s inputs.
Under formula = "mean_n", the squares are the SDs of every mean that
would be reported as x, whether or not n binary values can have it.