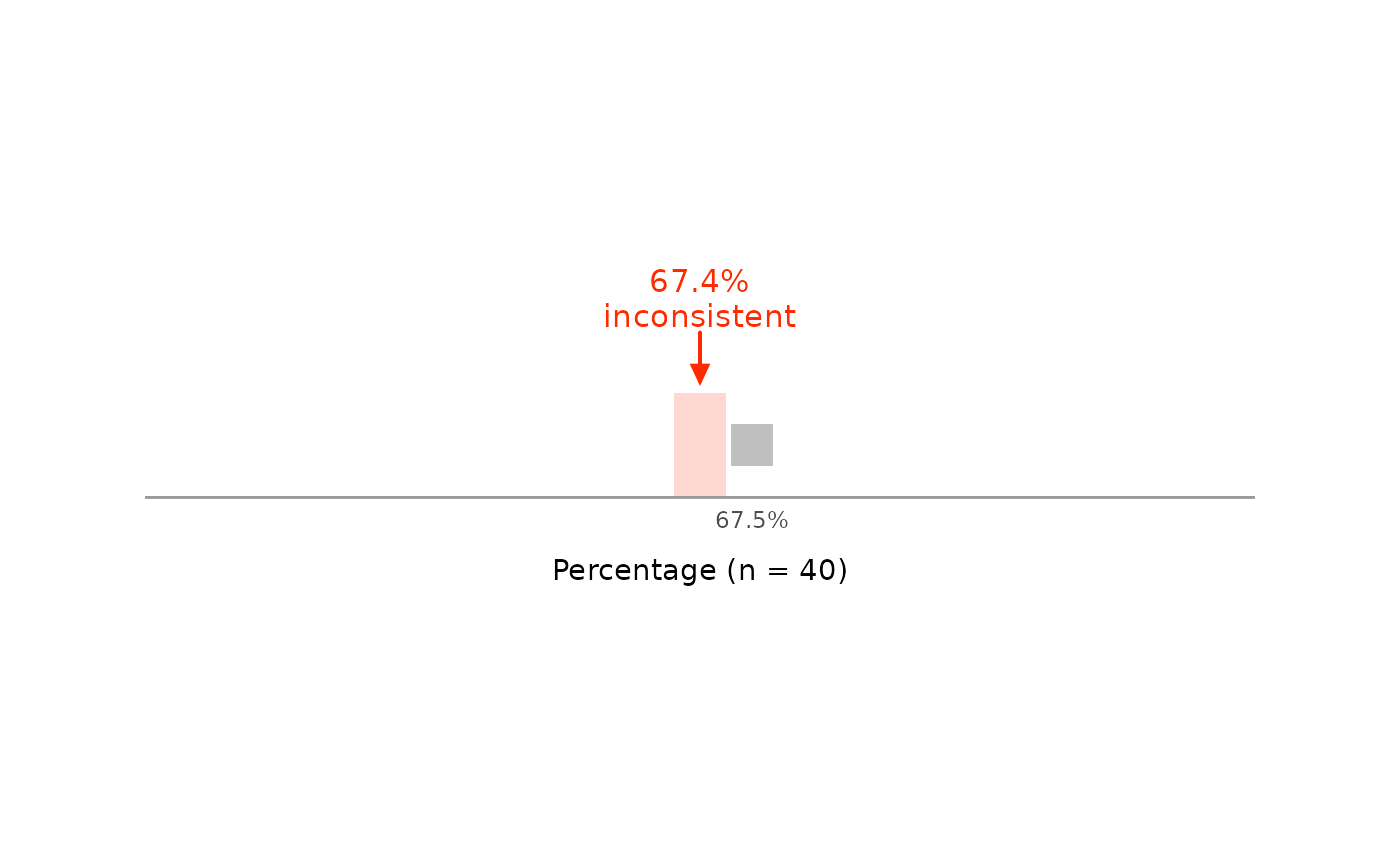

grim_plot_line() draws the GRIM test for a single value set as a
row of squares. Of all means (or percentages) that could have been
reported with digits_x decimal places, each square is one that a sample
of size n can have; the others are left out. The reported value is
marked above the row and labeled as consistent or inconsistent.
grim_plot_grid() shows many results at once; this function explains
one. grim_values() lists the unrounded means behind a reported one.
Arguments
- x, n, digits_x, items_averaged, x_meaning, rounding, threshold, symmetric
The same as in
grim(), butx,n,digits_x, anditems_averagedmust have length 1.- data_type
String.
"integer"if the values are whole numbers, as ingrim(). There is no default, so that every call states this assumption."continuous"andNAare errors: if the data may be continuous, there are no values to draw.- zoom
String. How much of the row to show:
"close"(the default),"medium", or"wide"; see Details.- color_con, color_incon
Strings. Color of the marker, the strip behind the squares, and the square at the reported value if it is consistent.
color_conapplies if the value is consistent,color_inconif not. Defaults are"#0047ff"and"#ff2a00".- color_attainable
String. Color of the squares for attainable values that were not reported, like the consistent cells of
grim_plot_grid()'s raster. Default is"grey75".
Details
With zoom = "close", the row shows 10 values on either side of
x, so that the marker and the strip behind it stand out. If x is
inconsistent, it widens until the nearest attainable value is in view,
but no farther than the row with zoom = "wide" is wide. It does not
widen further for the nearest one on the other side: attainable
percentages in particular can be dozens of values apart, so the squares
and the strip would shrink to specks.
With zoom = "medium", the row widens until the nearest attainable value
other than x is in view on either side, whether x is consistent or
not, which shows how far apart the attainable values are. Again, it
widens no farther than the row with zoom = "wide". Both settings test
at most 20,000 values, and warn if they stop short of an attainable value
for that reason.
Each attainable value is labeled below its square unless the squares are
too close together for that, as they mostly are with zoom = "wide". Then
the axis has the usual breaks, and if x is inconsistent, the nearest
attainable values are labeled above the row.
With zoom = "wide", the row runs from the whole number at or below x to
the next one up. With items_averaged = 1, about n of the values in
this unit are attainable, or all if n exceeds 10 ^ digits_x. With
x_meaning = "percentage", the unit is that of the proportion GRIM
tests, so the row runs from 0% to 100%, and about n + 1 values are
attainable, or all if n exceeds 10 ^ (digits_x + 2). Squares too
narrow to be seen as such are drawn as ticks of the same height.
The strip behind the squares is the range of unrounded means that would
have been reported as x, from roundwork::unround(). The value is
consistent exactly if a square stands within the strip. Under methods
such as "trunc" or "ceiling", one edge of the strip is not part of it,
so a square on that edge does not count.
See also
grimmer_plot_line() for the same figure over standard
deviations.
Examples
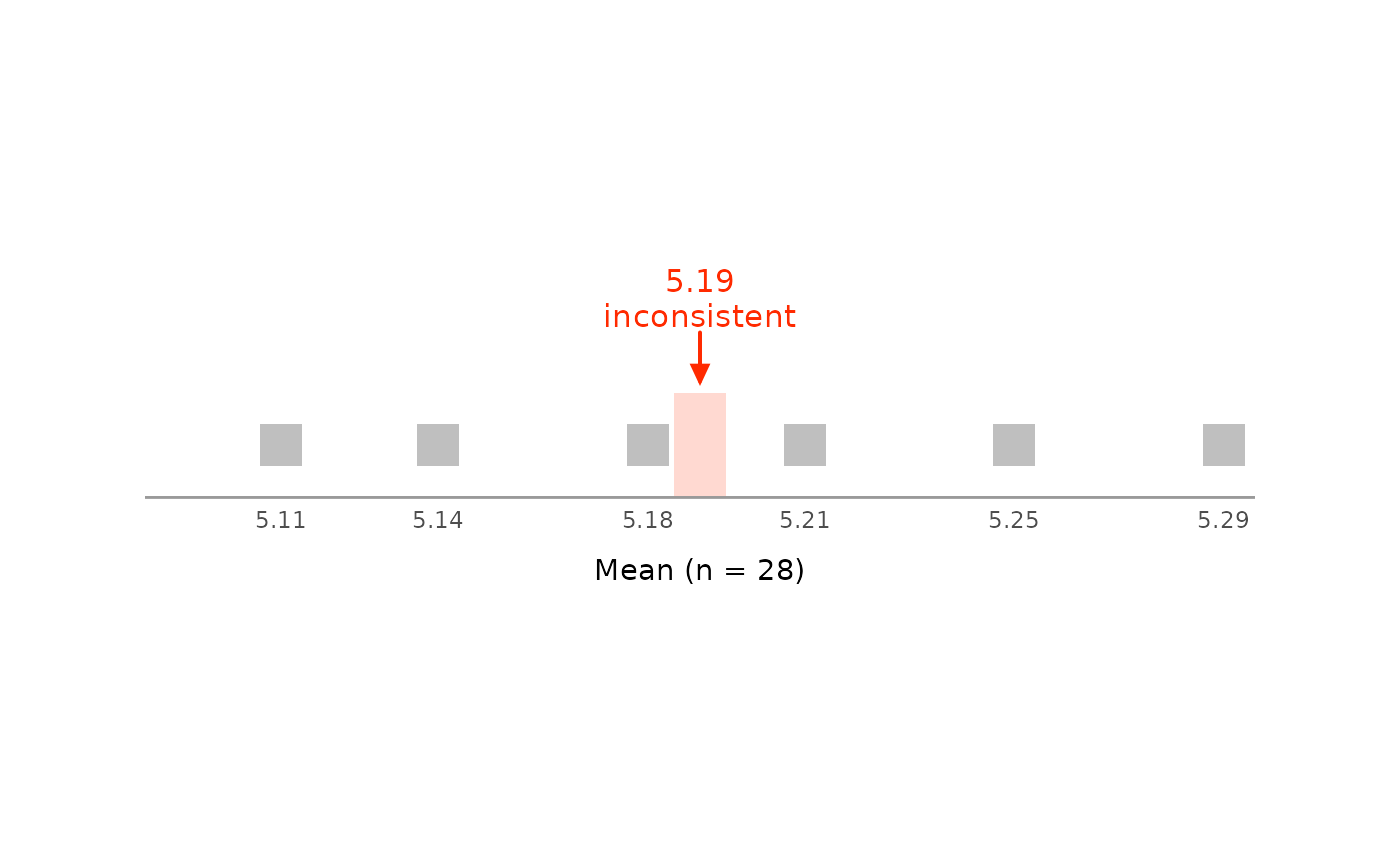
# A mean of 5.19 is not consistent with a sample size of 28:
# no square stands where the marker points.
grim_plot_line(x = 5.19, n = 28, digits_x = 2, items_averaged = 1, data_type = "integer")
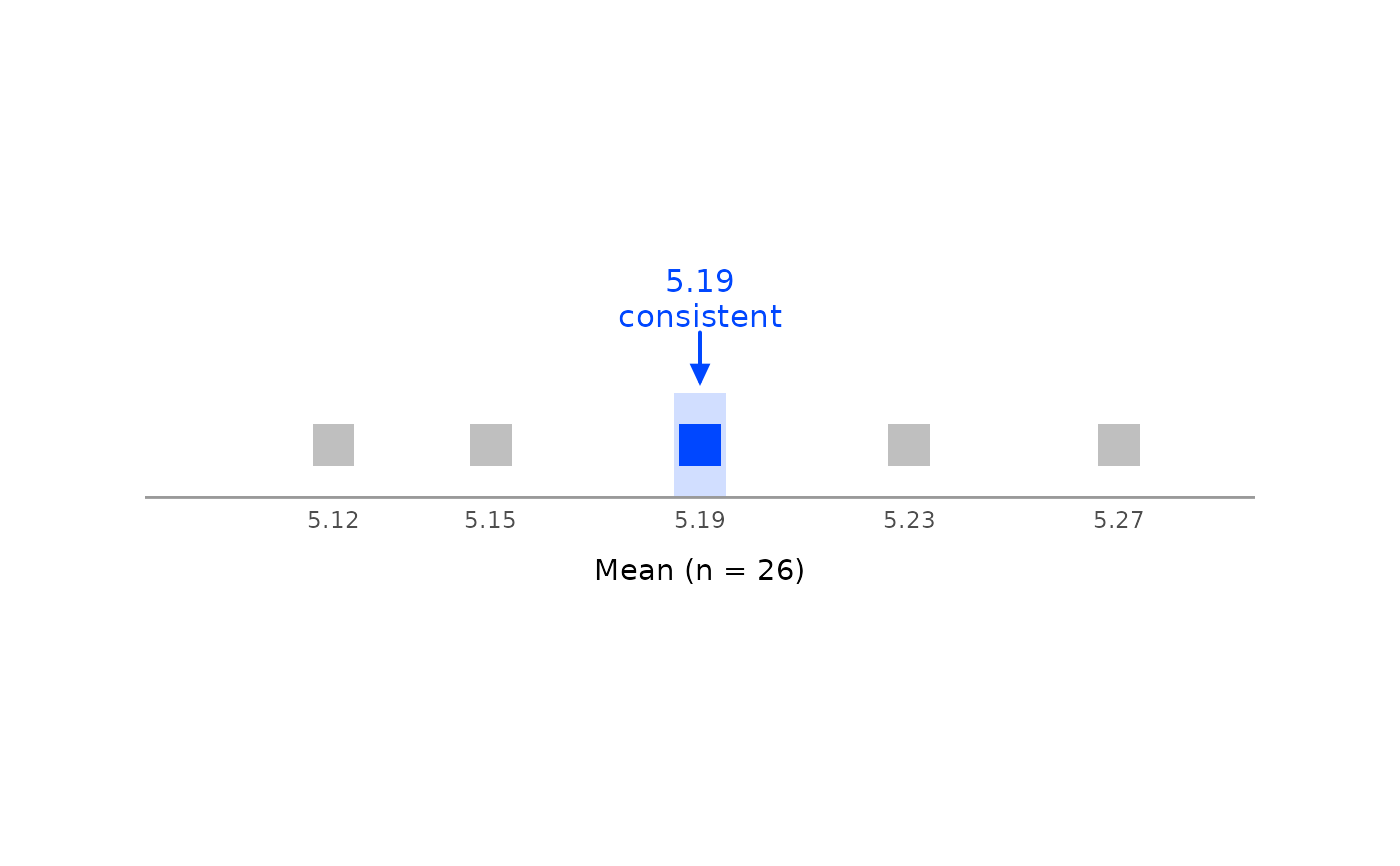
 # With `n = 26`, it is:
grim_plot_line(x = 5.19, n = 26, digits_x = 2, items_averaged = 1, data_type = "integer")
 # The same for a percentage:
grim_plot_line(
x = 67.4,
n = 40,
digits_x = 1,
items_averaged = 1,
data_type = "integer",
x_meaning = "percentage"
)