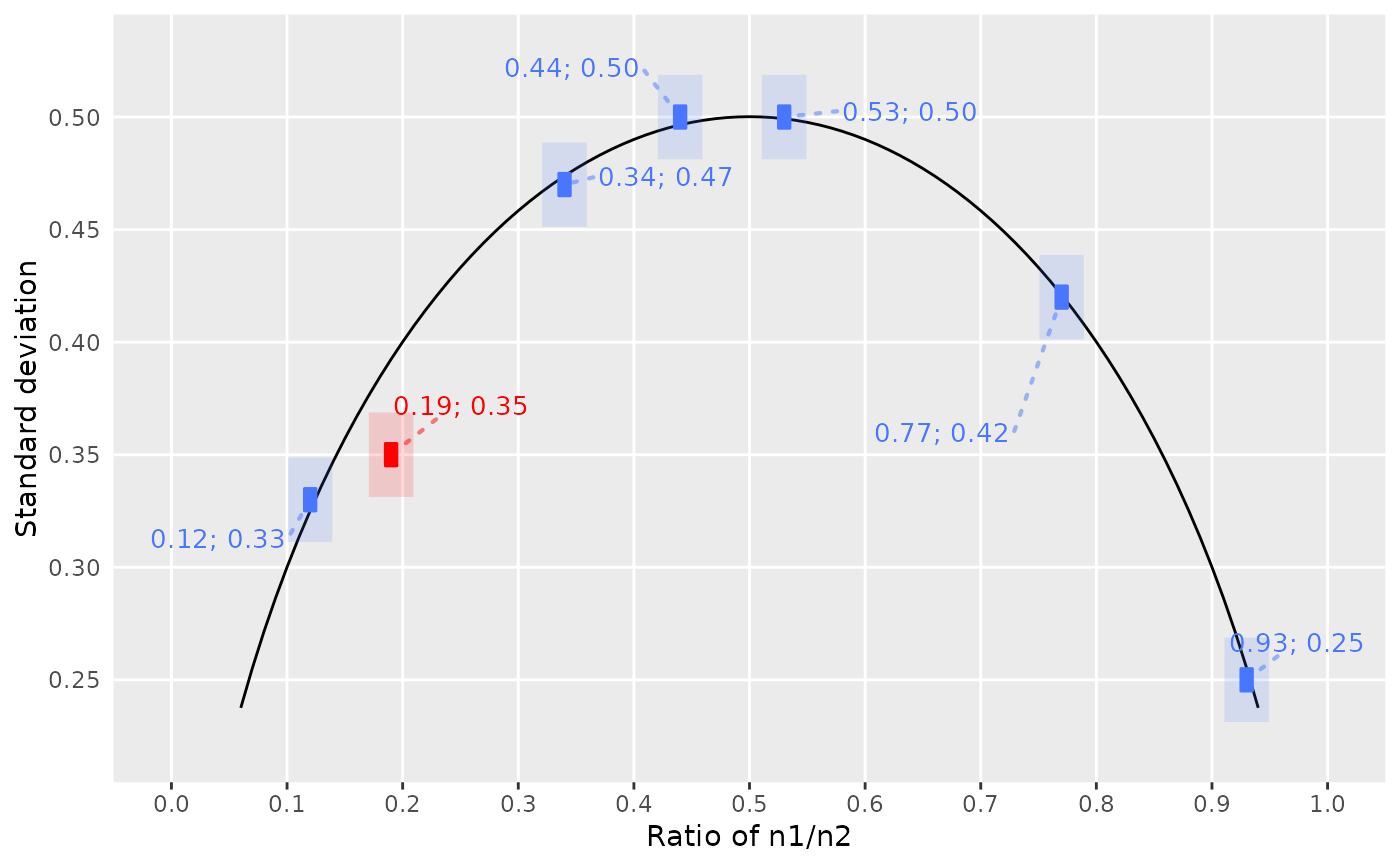
Plot a distribution of binary data and their mutual DEBIT
consistency. Call this function only on a data frame that resulted from a
call to debit_map().
Various parameters of the individual geoms can be controlled via arguments.
Usage
debit_plot(
  data,
  show_outer_boxes = TRUE,
  show_labels = TRUE,
  show_full_scale = TRUE,
  show_theme_other = TRUE,
  color_cons = "royalblue1",
  color_incons = "red",
  line_alpha = 1,
  line_color = "black",
  line_linetype = 1,
  line_width = 0.5,
  line_size = 0.5,
  rect_alpha = 1,
  tile_alpha = 0.15,
  tile_height_offset = 0.025,
  tile_width_offset = 0.025,
  tile_height_min = 0.0375,
  tile_width_min = 0.0385,
  label_alpha = 0.5,
  label_linetype = 3,
  label_size = 3.5,
  label_linesize = 0.75,
  label_force = 175,
  label_force_pull = 0.75,
  label_padding = 0.5
)
Arguments
- data
Data frame. Result of a call to
debit_map().- show_outer_boxes
Logical. Should outer tiles surround the actual data points, making it easier to spot them and to assess their overlap? Default is
TRUE.- show_labels
Logical. Should the data points have labels (of the form "mean; SD")? Default is
TRUE.- show_full_scale
Logical. Should the plot be fixed to full scale, showing the entire consistency line independently of the data? Default is
TRUE.- show_theme_other
Logical. Should the theme be modified in a way fitting the plot structure? Default is
TRUE.- color_cons, color_incons
Strings. Colors of the geoms representing consistent and inconsistent values, respectively.
- line_alpha, line_color, line_linetype, line_width, line_size
Parameters of the curved DEBIT line.
- rect_alpha
Parameter of the DEBIT rectangles. (Due to the nature of the data mapping, there can be no leeway regarding the shape or size of this particular geom.)
- tile_alpha, tile_height_offset, tile_width_offset, tile_height_min, tile_width_min
Parameters of the outer tiles surrounding the DEBIT rectangles. Offset refers to the distance from the rectangles within.
- label_alpha, label_linetype, label_size, label_linesize, label_force, label_force_pull, label_padding
Parameters of the labels showing mean and SD values. Passed on to
ggrepel::geom_text_repel(); see there for more information.
Details
The labels are created via ggrepel::geom_text_repel(), so the
algorithm is designed to minimize overlap with the tiles and other labels.
Yet, they don't take the DEBIT line into account, and their locations are
ultimately random. You might therefore have to resize the plot or run the
function a few times until the labels are localized in a satisfactory way.
An alternative to the present function would be an S3 method for
ggplot2::autoplot(). However, a standalone function such as this allows
for customizing geom parameters and might perhaps provide better
accessibility overall.