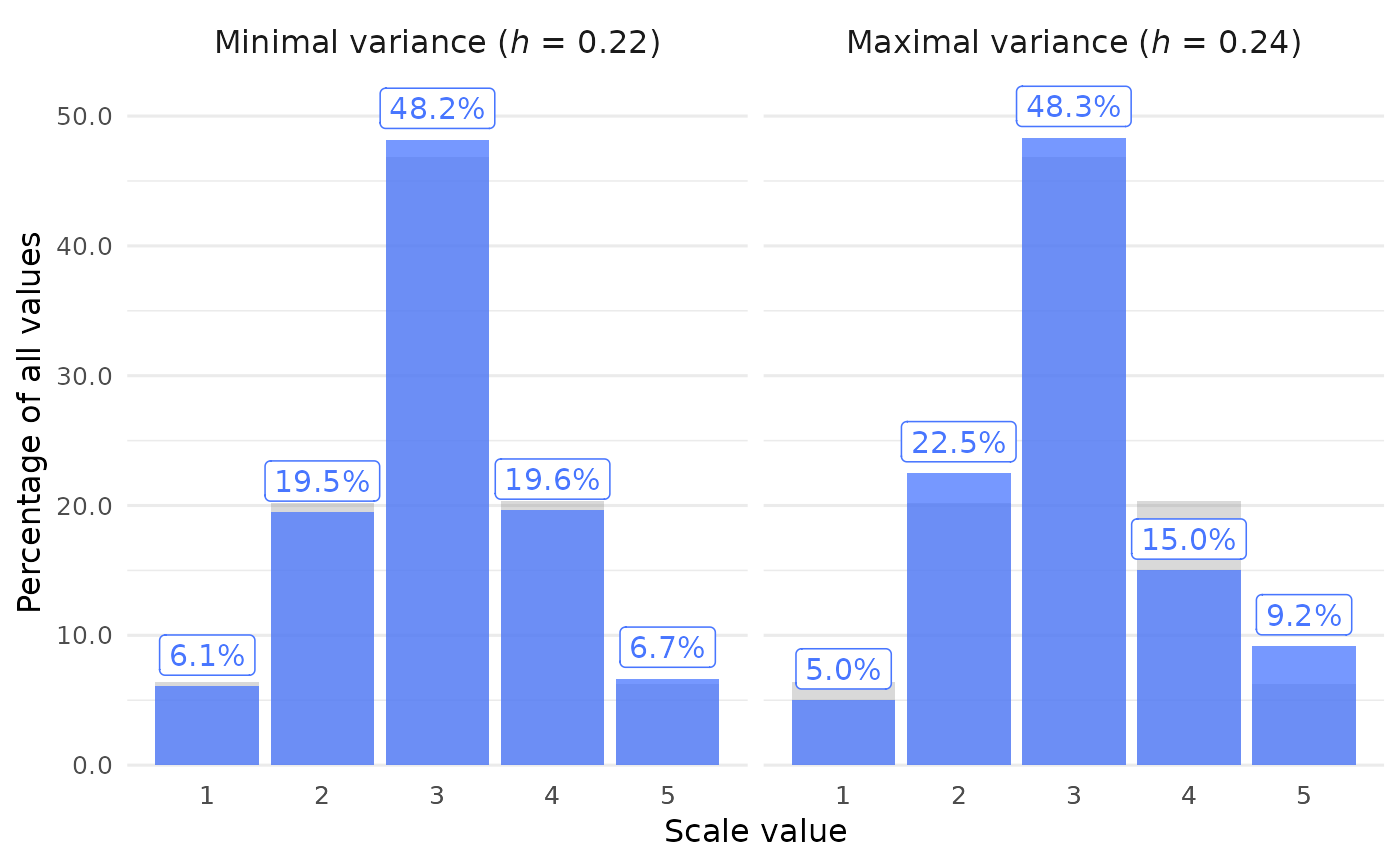
Call sprite_plot_bar() to get a barplot of SPRITE results.
For each scale value, the bars show how often this value appears in the mean samples with the minimum or maximum horns index (\(h\)). This displays the typical sample with the least or most amount of variance from among all SPRITE samples.
Usage
sprite_plot_bar(
  data,
  min_max = c("both", "min", "max"),
  format = c("percent", "absolute_percent", "absolute", "relative"),
  samples = c("mean", "all"),
  overlay = c("all_avg", "none", "interval", "pointinterval", "dots"),
  facet_labels = c("Minimal variance", "Maximal variance"),
  facet_labels_parens = "h",
  bar_alpha = 0.75,
  bar_color = "royalblue1",
  show_text = TRUE,
  text_color = bar_color,
  text_size = 12,
  text_offset = 0.05,
  mark_thousand = ",",
  mark_decimal = "."
)
Arguments
- data
List returned by
sprite_generate().- min_max
String (length 1). Which plot panel(s) to show? Options are
"both"(the default),"min", and"max".- format
String (length 1). What should the bars show? The default is
"percent". Similarly,"absolute_percent"shows the count of each scale value and its percentage of all values. Other options are"absolute"and"relative"frequencies.- samples
String (length 1). How to aggregate the samples? Either take the average sample (
"mean", the default) or the sum of all samples ("all"). This only matters if absolute frequencies are shown.- overlay
String (length 1). Visualization mode for the frequency distribution across all samples, overlaid behind the main bars. Only applies when
samples = "mean". Options:"all_avg"(default): gray background bars showing the mean frequency across all samples."none": no overlay."interval": nested quantile intervals viaggdist::stat_interval()(requires theggdistpackage andinclude = "all"inclosure_generate())."pointinterval": median point with quantile interval lines viaggdist::stat_pointinterval()(same requirements as"interval")."dots": quantile dot plot viaggdist::stat_dots()(same requirements as"interval").
- facet_labels
String (length 2). Labels of the two individual panels. Set it to
NULLto remove the labels. Default isc("Minimal variance", "Maximal variance").- facet_labels_parens
String (length 1). Italicized part of the facet labels inside the parentheses. Set it to
NULLto remove the parentheses altogether. See details. Default is"h".- bar_alpha
Numeric (length 1). Opacity of the bars. Default is
0.75.- bar_color
String (length 1). Color of the bars. Default is
"#5D3FD3", a purple color.- show_text
Logical (length 1). Should the bars be labeled with the corresponding frequencies? Default is
TRUE.- text_color
String (length 1). Color of the frequency labels. By default, the same as
bar_color.- text_size
Numeric (length 1). Base font size in pt. Default is
12.- text_offset
Numeric (length 1). Distance between the text labels and the bars. Default is
0.05.- mark_thousand, mark_decimal
Strings (length 1 each). Delimiters between groups of digits in text labels. Defaults are
","formark_thousand(e.g.,"20,000") and"."formark_decimal(e.g.,"0.15").
Examples
# Run SPRITE first
data <- sprite_generate(
  mean = "3.0",
  sd = "1.0",
  n = 120,
  scale_min = 1,
  scale_max = 5,
  stop_after = 150
)
#>
#> ✔ All SPRITE results found

sprite_plot_bar(data)