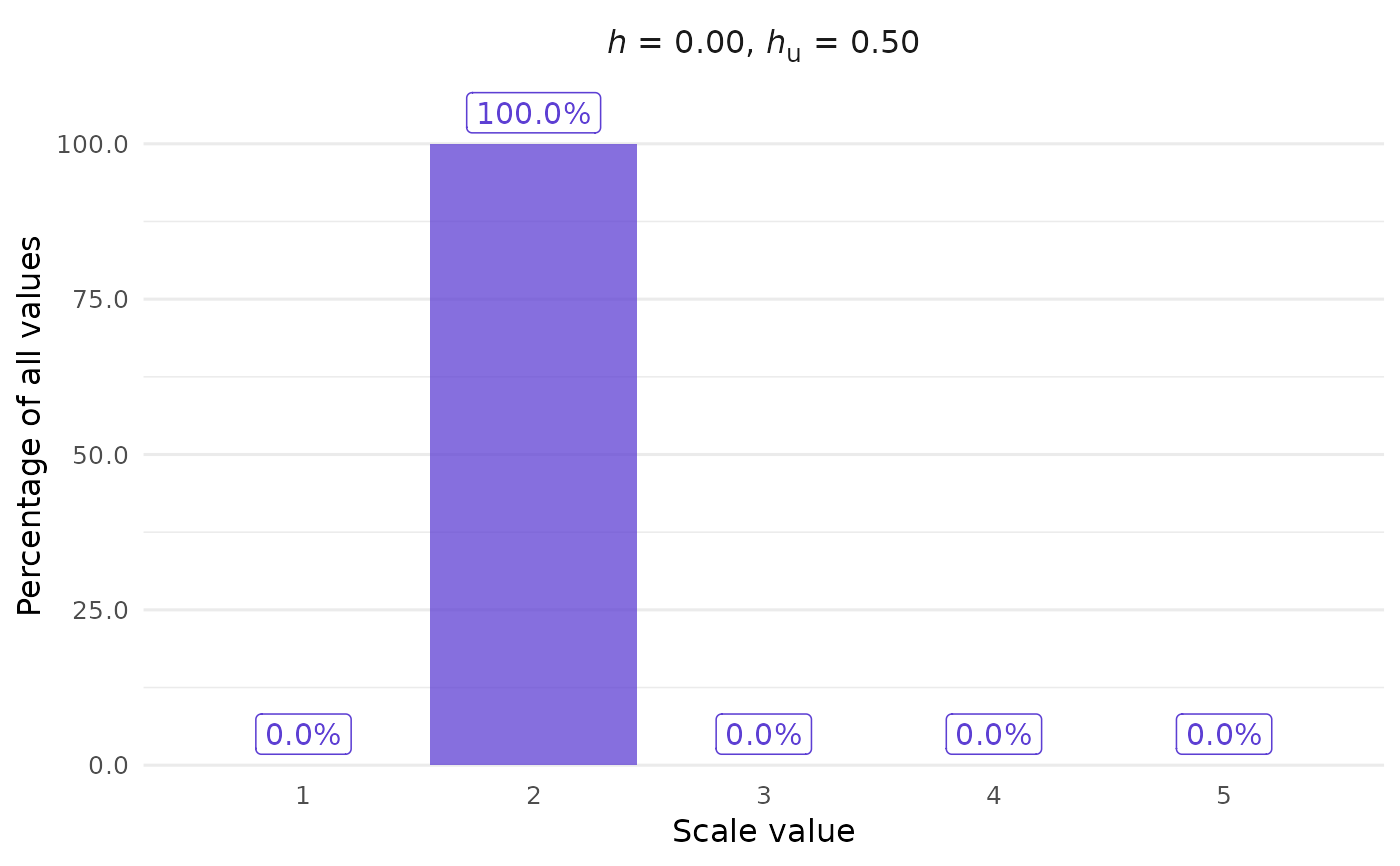
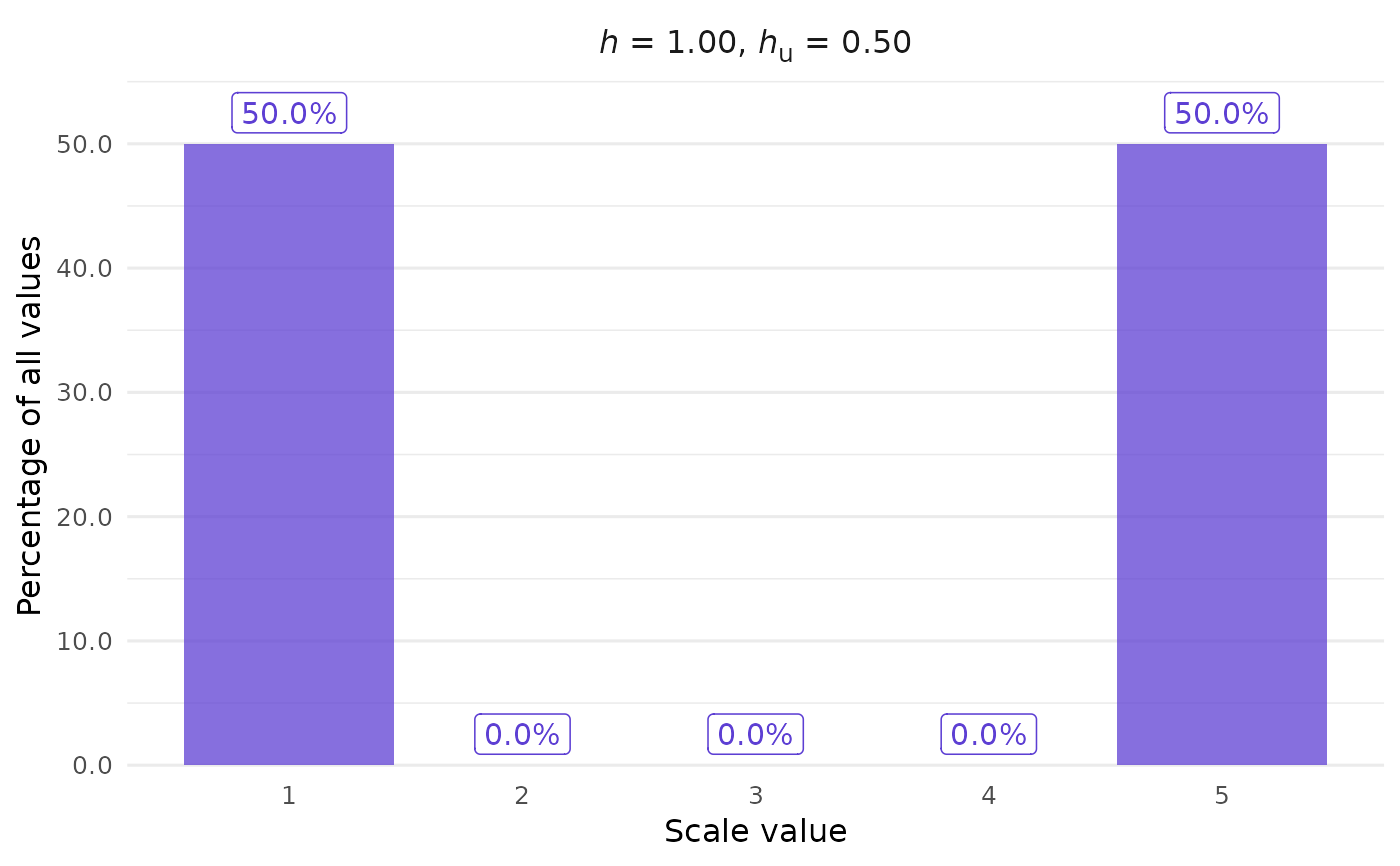
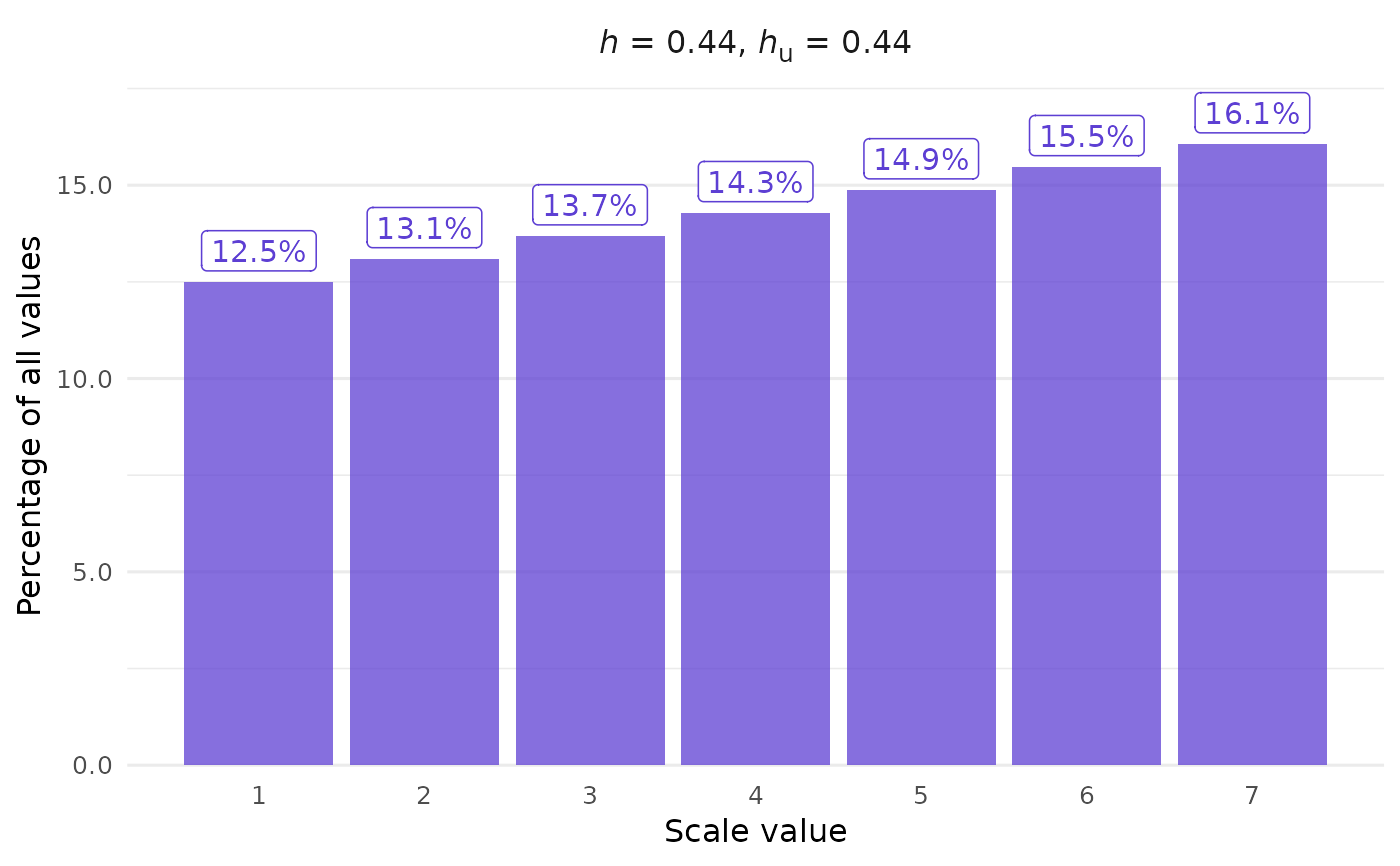
The demo_plot_*() functions are variants of closure_plot_*()
that directly visualize a given frequency distribution. Their purpose is to
illustrate general points about CLOSURE-type techniques and the horns
index.
demo_plot_bar()is likeclosure_plot_bar()except it is never faceted.demo_plot_horns_histogram()is likeclosure_plot_horns_histogram().demo_plot_ecdf()is likeclosure_plot_ecdf().
The top line shows the horns index of the given distribution (\(h\)) and
the horns index of a hypothetical uniform distribution with the same number
of scale points (\(h_u\)). See horns() and horns_uniform() for the
corresponding functions.
Usage
demo_plot_bar(
  freqs,
  format = c("percent", "absolute_percent", "absolute", "relative"),
  bar_alpha = 0.75,
  bar_color = "#5D3FD3",
  show_text = TRUE,
  text_color = bar_color,
  text_size = 12,
  text_offset = 0.05,
  mark_thousand = ",",
  mark_decimal = "."
)
Arguments
- freqs
Numeric. Vector of relative or absolute frequencies to visualize.
- format
String (length 1). What should the bars show? The default is
"percent". Similarly,"absolute_percent"shows the count of each scale value and its percentage of all values. Other options are"absolute"and"relative"frequencies.- bar_alpha
Numeric (length 1). Opacity of the bars. Default is
0.75.- bar_color
String (length 1). Color of the bars. Default is
"#5D3FD3", a purple color.- show_text
Logical (length 1). Should the bars be labeled with the corresponding frequencies? Default is
TRUE.- text_color
String (length 1). Color of the frequency labels. By default, the same as
bar_color.- text_size
Numeric (length 1). Base font size in pt. Default is
12.- text_offset
Numeric (length 1). Distance between the text labels and the bars. Default is
0.05.- mark_thousand, mark_decimal
Strings (length 1 each). Delimiters between groups of digits in text labels. Defaults are
","formark_thousand(e.g.,"20,000") and"."formark_decimal(e.g.,"0.15").